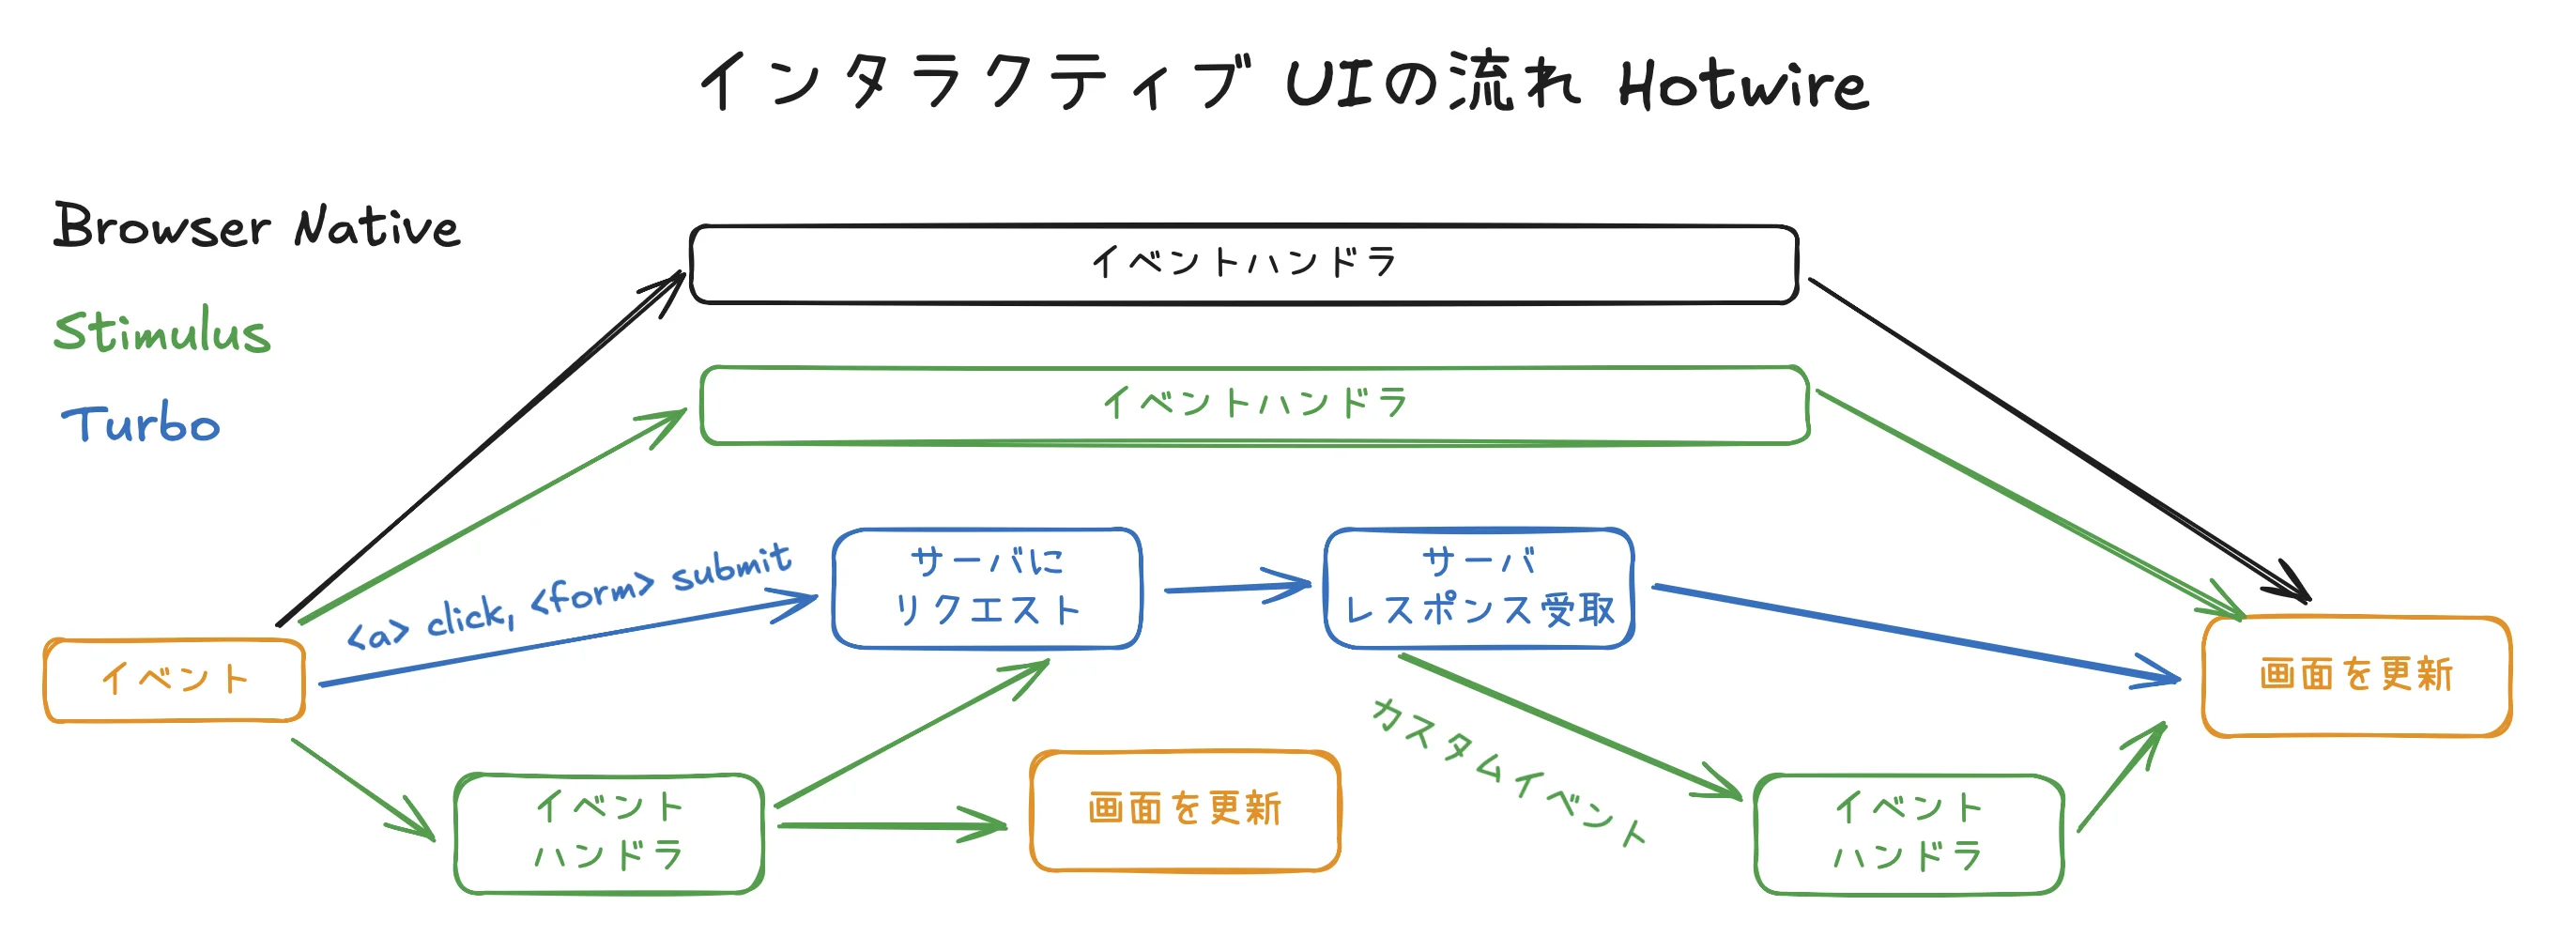
コード例
Chart.js埋め込み
ここで作るのは下記のようなUIです。
デモはこちらに用意しています。
考えるポイント
- Chart.jsを使ってChartを表示するのが目的です
- Chartを表示するにはデータが入りますが、これは2箇所から取得します
- 最初のロードの時はサーバから初期データを受け取り、Chartを表示します
- 各スライダーを操作すると、そのデータを使ってChartを表示します
- サーバからデータを受け取るのは初回ロードですので、非同期でデータは受け取りません
- Stimulusだけで実装します
- Stimulus Controllerの制御範囲を考えます
- Chartおよび各スライダーがStimulus controllerの制御範囲になります
- Stimulus Controllerのステートを検討します
- Arrayのような形でステートを持ちます。この場合はStimulusのValuesが便利です
なおReactの場合はインテグレーションであるreact-chartjs-2を使うことが多いかと思います。しかし2024年12月4日現在、このインテグレーションのドキュメントサイトはダウンしていて閲覧できません。
ライブラリー選定の一般論としては、自分で簡単に実装できるものはライブラリーを使用せずに自分で実装するのが適切だと思います。下記に示す通り、Stimulusは簡単ですのでインテグレーションに頼らなくて済みます。
コード
Chart.jsを埋め込んだページ
<% set_breadcrumbs [["ChartJS", component_path(:chartjs)]] %>

<%= render 'template',
           title: "ChartJS",
           description: "" do %>
  <div data-controller="chartjs"
       data-chartjs-label-value="UFO sightings per year!!!!"
       data-chartjs-data-value="<%= [{ year: 2010, count: 10 },
                                     { year: 2011, count: 20 },
                                     { year: 2012, count: 15 },
                                     { year: 2013, count: 25 },
                                     { year: 2014, count: 22 },
                                     { year: 2015, count: 30 },
                                     { year: 2016, count: 28 },
                                    ].to_json %>">

    <div class="flex justify-between">
      <% [2010, 2011, 2012, 2013, 2014, 2015, 2016].each_with_index do |year, index| %>
        <div>
          <div><%= year %>:</div>
          <input type="range" min="0" max="100" value="10" step="10" class="w-20"
                 data-chartjs-bar-param="<%= index %>"
                 data-action="input->chartjs#changeBar"/>
        </div>
      <% end %>
    </div>
    <div class="w-full">
      <canvas data-chartjs-target="chart"></canvas>
    </div>
  </div>
<% end %>
- 簡略化のために、Chartに渡すデータはViewに埋め込んでいます。通常であればControllerからインスタンス変数で渡すでしょう
- データは
to_jsonでJSONに変換しておけば、StimulusのValueとして正しく処理されます
- データは
<input type="range" ...>タグのところはデータを変更するスライダーです。ここがイベントを受け取るActionになりますdata-action="input->chartjs#changeBar"により、スライダーの値が変更されるとChartjsControllerのchangeBarメソッドが呼び出されます- この際、どのデータを変更するべきかは
data-chartjs-bar-paramで指定します
<canvas data-chartjs-target="chart"></canvas>はChartjsControllerからの出力を受けるtargetです
ChartjsController Stimulus controller
import {Controller} from "@hotwired/stimulus"
import Chart from "chart.js/auto"

// Connects to data-controller="chartjs"
export default class extends Controller {
  static values = {
    data: {type: Array, default: []},
    label: String
  }
  static targets = ["chart"]

  connect() {
  }

  disconnect() {
    this.chart?.destroy()
  }

  changeBar(event) {
    const value = event.currentTarget.value
    const barIndex = Number(event.params.bar)
    const newDataValue = [...this.dataValue]
    newDataValue[barIndex] = {year: 2010 + barIndex, count: value}

    // We create a new dataValue object and use the
    // `this.dataValue` setter to update the value.
    // This is to trigger the `this.dataValueChange()` callback.
    // It is unnecessary if you call `this.#render()` directly
    // in this function.
    this.dataValue = newDataValue
  }

  dataValueChanged() {
    this.#render()
  }

  #render() {
    this.#renderChart()
  }

  #renderChart() {
    const data = this.dataValue
    if (this.chart) {
      this.chart.data = this.#data()
      this.chart.update()
    } else {
      this.chart = new Chart(
        this.chartTarget,
        {
          type: 'bar',
          data: this.#data()
        }
      );
    }
  }

  #data() {
    return {
      labels: this.dataValue.map(row => row.year),
      datasets: [
        {
          label: this.labelValue,
          data: this.dataValue.map(row => row.count)
        }
      ]
    }
  }
}
- Chartjsを制御するStimulus controllerです
static valuesで使用するStimulus Valuesを宣言していますdataはChartに表示するデータです。Array型として持ちます。HTMLのdata-chartjs-data-values属性にJSON型でステートが保持されますlabelはChartの表題になります
static targetsでControllerで処理されたデータの出力先を指定します- 今回はChartを表示する
<canvas>タグを指定します
- 今回はChartを表示する
disconnect()はライフサイクルに関するものです。このStimulus Controllerが画面から消えるなどした場合に呼び出されます。ここではChartjsオブジェクトを削除して、メモリリークを防ぎますchangeBarはイベントハンドラです。スライダーをクリックして値を変更した時に呼び出されます- 注意点しなければならないのは
newDataValueという新しいArrayを作ってthis.dataValueにセットしている点です。古いthis.dataValueの値を変更するだけではダメで、全く新しいArrayを渡す必要があります - 従来のArrayを変更しただけでは
dataValueChangedコールバックが呼ばれません。この辺りはReactのステート変更と全く同じです
- 注意点しなければならないのは
dataValueChangedはStimulus Valueステートが変更された時に自動的に呼ばれるコールバックです。この中で#render()を呼びます#render()ではさらに#renderChart()を呼び出し、Chart.jsにデータを渡す処理を書いています。ここではChart.jsのチュートリアル通りのデータを渡しています- 初回ロードの時は新しいChartを
new Chart()で作ります - Chartのデータを変更するときは、
this.chartにセットされた既存のChartを書き換えてupdate()を呼びます
- 初回ロードの時は新しいChartを
まとめ
- Stimulusを使ってChart.jsを制御するのは比較的容易です。インテグレーション等を使う必要がありません
- 初回ロード時にChart.jsにデータを渡すのも容易です。サーバエンドポイントを用意して
fetch()でデータを取る必要はありません。また<script type="application/json">などを使ってデータを埋め込む必要もありません - Stimulusは既存のDOMから情報を取得したり、DOMに情報を書き込んだりするように設計されています。そのため第3者ライブラリとの統合は比較的容易です
